Climate
Greenhouse Gases
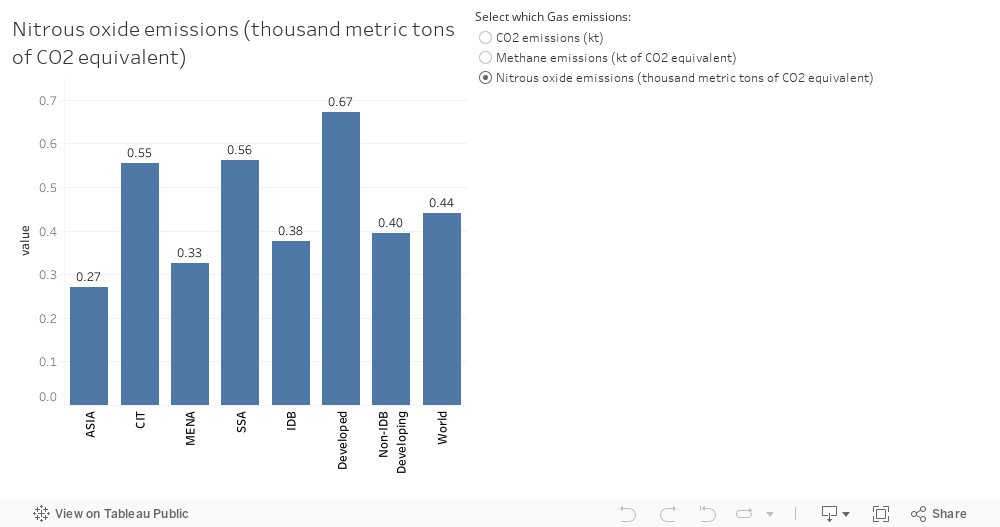
Following chart positions IDB member country aggregates vis-a-vie other economies on share of main greenhouse gases (2016):
- CO2 emissions (Kilo Tons)
- Methane emissions (kilo ton of CO2 equivalent)
- Nitrous oxide emissions (thousand metric tons of CO2 equivalent)
Climate Indices
Following Charts analyse the situation of member countries with respect to Environment Performance Index (2016), Global Climate Risk Index (2014), and Environmental Sustainability Index (ESI) (2005) .
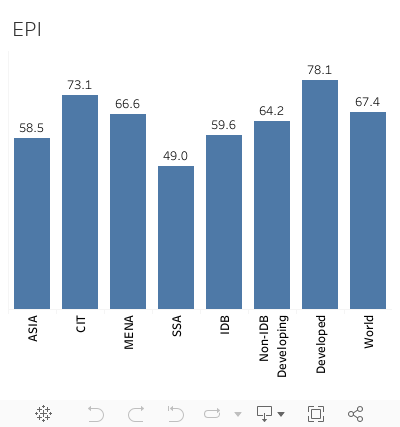
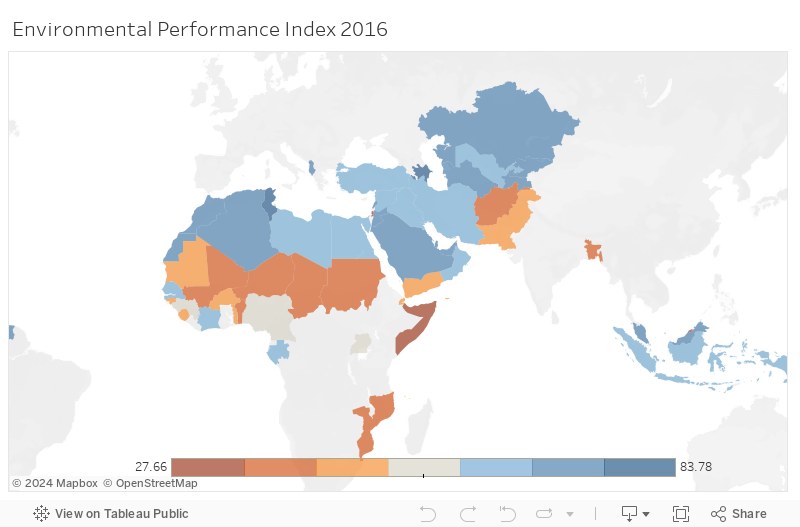
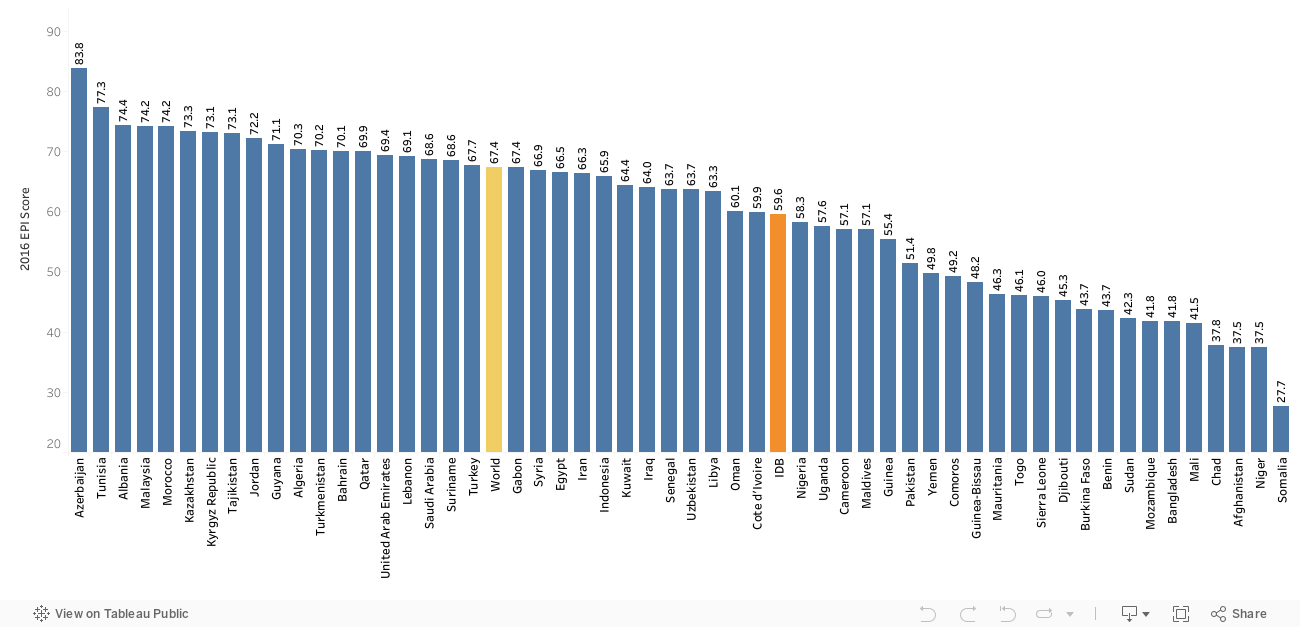
Environment Performance Index (EPI - 2016)
The data along with report is maintained by Yale University center for Environmental Law and Policy.
IDB regions
IDB Countries on the map
IDB countries performance
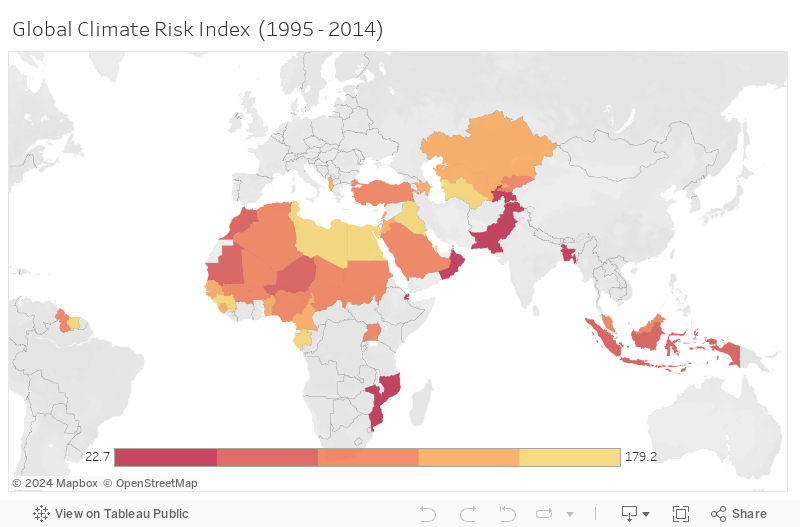
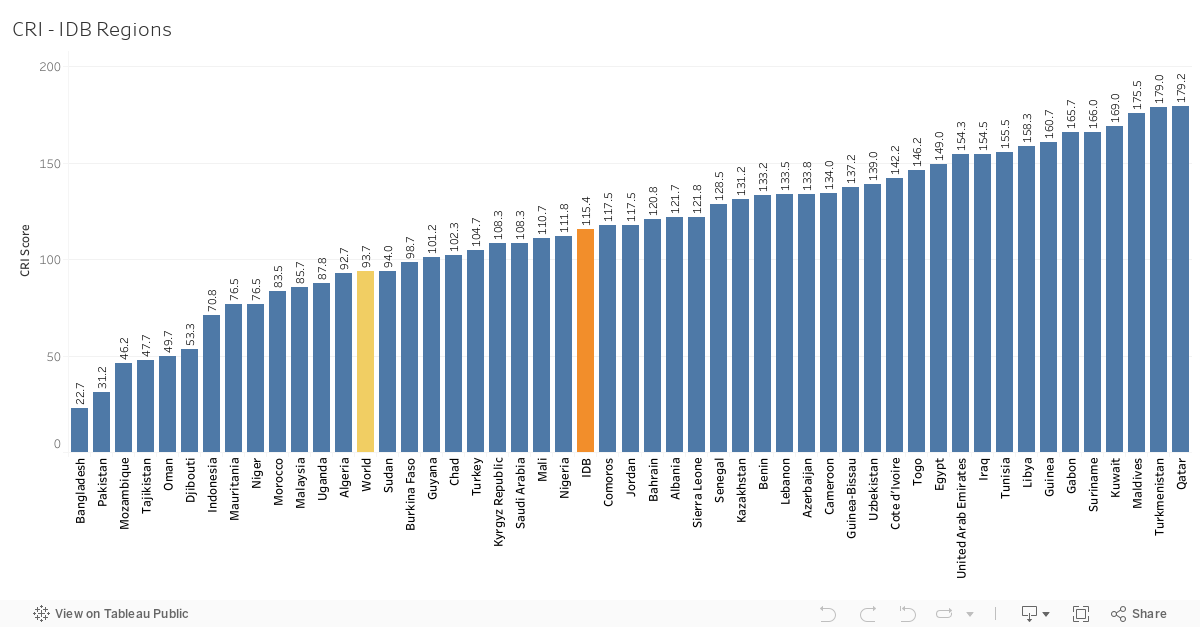
Global Climate Risk Index (GCRI - 2014)
This index is maintained by German Watch and can be found here.
IDB regions

IDB Countries on the map
IDB countries performance
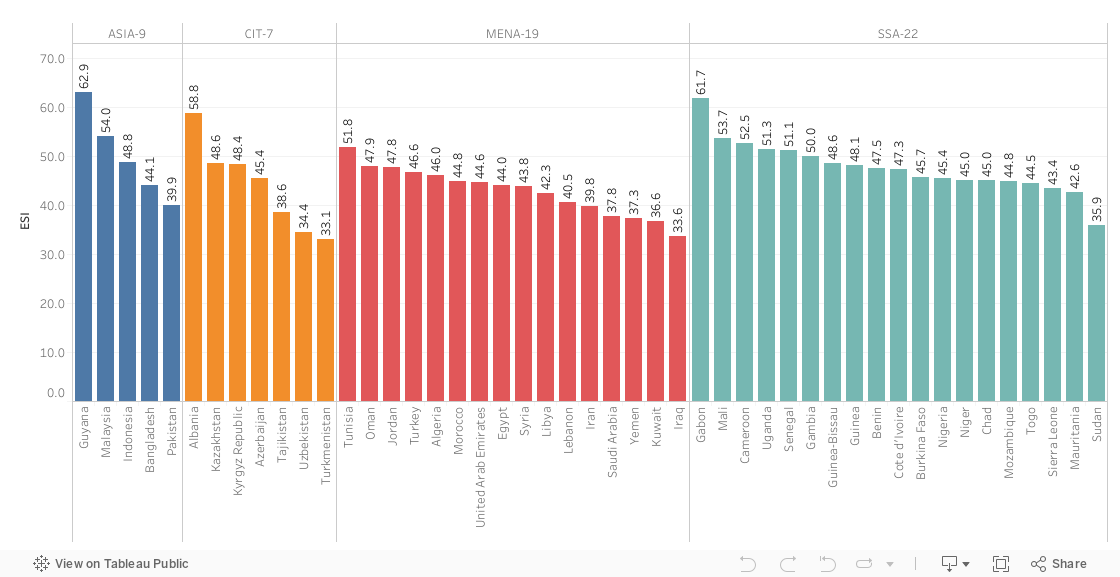
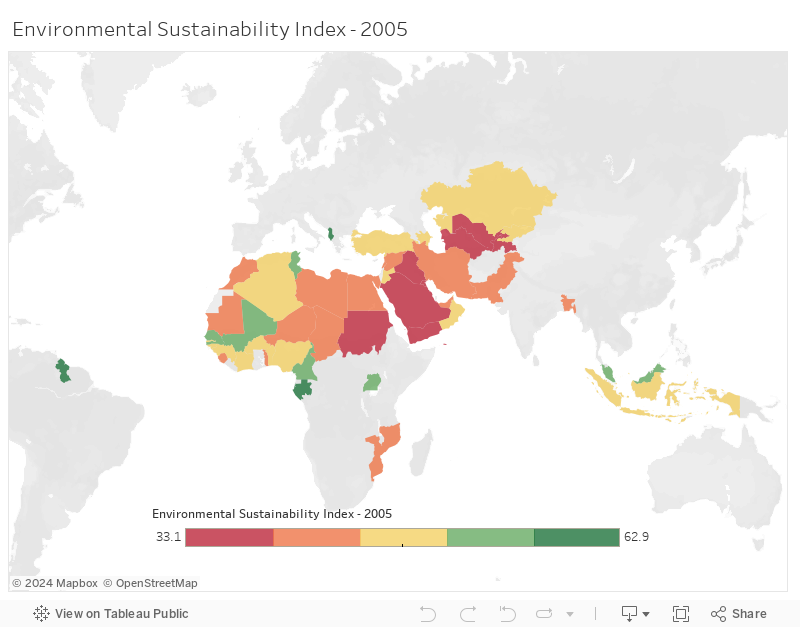
Environmental Sustainablity Index (ESI - 2005)
The data is maintained by NASA's Socioeconomic Data and Application Center (SEDAC).
IDB regions

IDB Countries on the map
IDB countries performance